ISER - Internal Service Expense Report
An internal web tool for server management.

Objective
In SAP, many groups or organizations are continuously charged for servers that do not exist anymore. Hence, dead servers. To address this problem, we break down the project into three phases. See the project scope below.
Project Scope
1. Expense Transparency
Create a transparent expense report for the spending on internal servers through all organization from top to bottom.
2. Server Bio
Establish profiles for each servers, so we could have a better understanding of server usage and background information.
3. Call for Actions
Generate tickets for multiple purposes, such as update the servers’ info or terminate the inactive servers.
Design Goal - A suite for internal servers management
To achieve all the scopes of the project, we decide to create a tool for internal server management, which includes spending reports, servers’ bio, and a ticket system. The spending report is our starting point since we want to know which organizations are spending money on servers, and how many they are spending monthly, which leads to more questions - Are those servers active or inactive? What's the utility of those servers? If the server is dormant, can we shut it down to save money?


But why three apps? Because we have a different level of permission or access to different users. For example, high-level personnel can access the expense report while the server owner might only have permission to search through the server profile.
A fun fact for ISER’s logo design - It’s sound like ICE, let’s make an ice cube as our app logo!
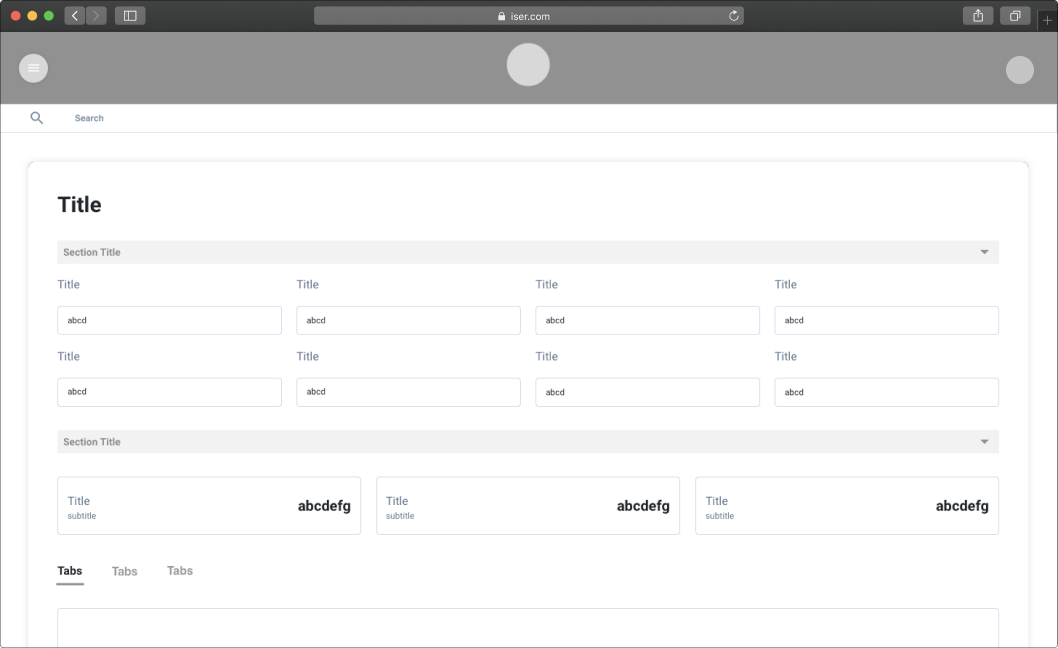
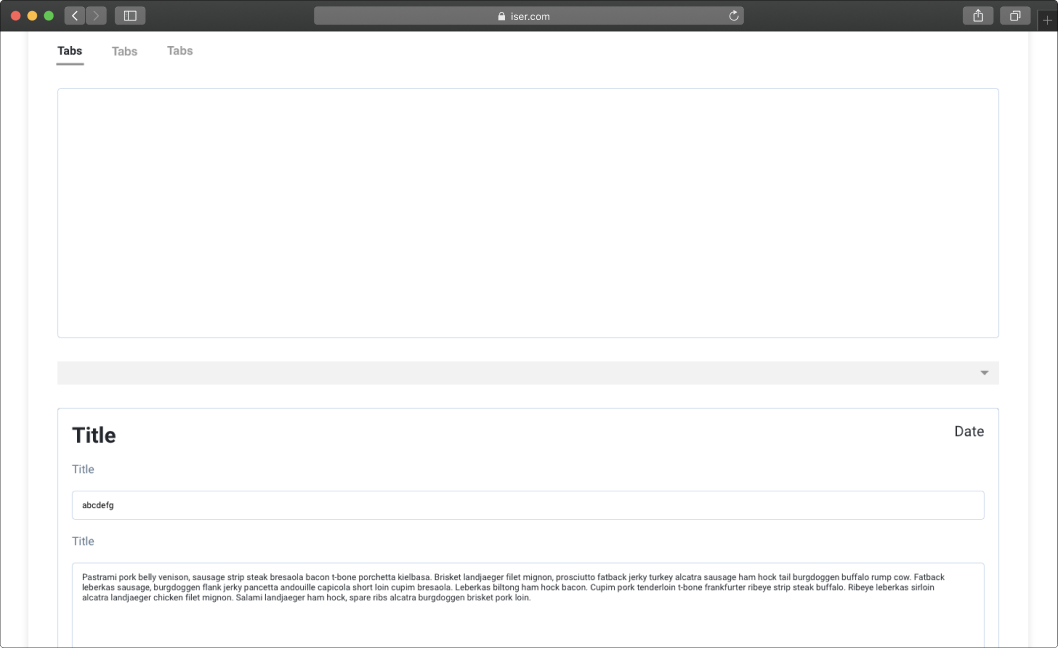
Design Language 🎨
To keep consistency for this three in one suite, we'll need a universal style guide and design language, which includes the layout, UI style, icons, etc.
Expense Report
In the Expense Report, high-level staff can monitor the expense on the internal servers through all SAP cost centers from top to bottom. This can help the users to monitor the spending trends, budget allocations, and spending deep dive, etc.
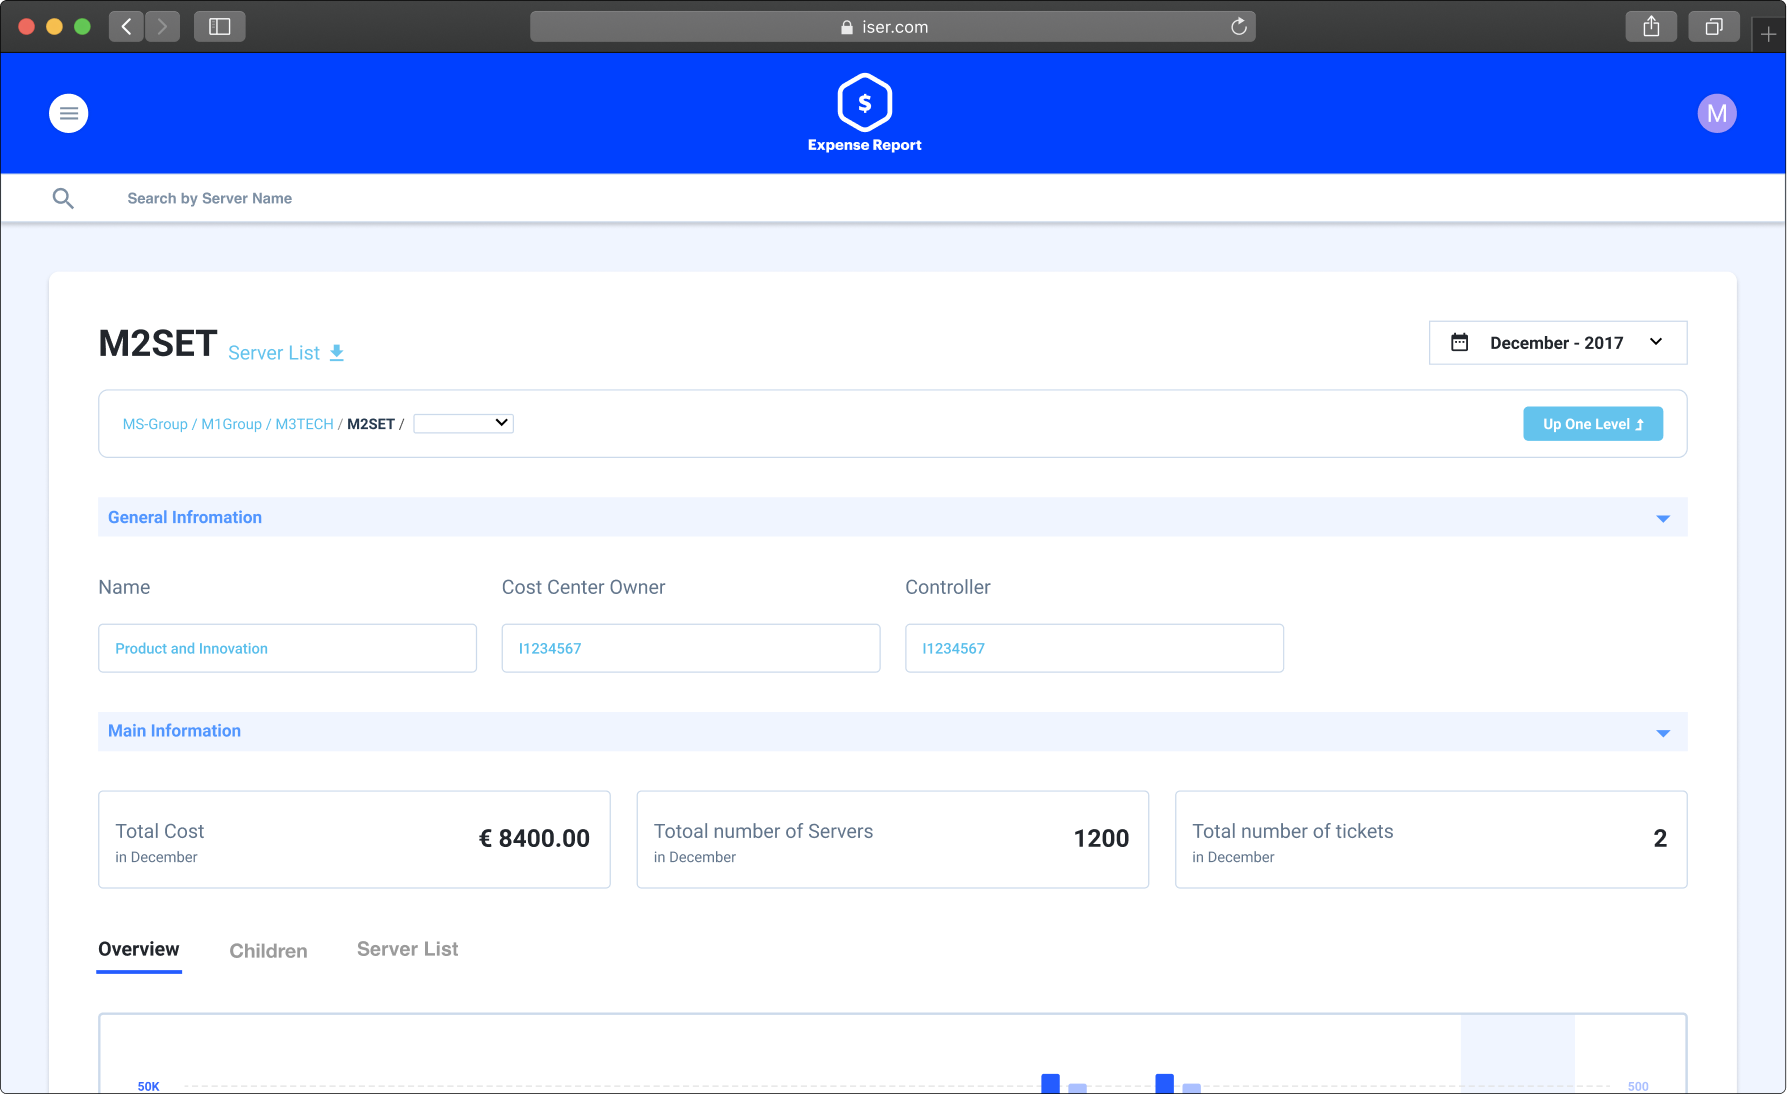
Basic background info for the organization.
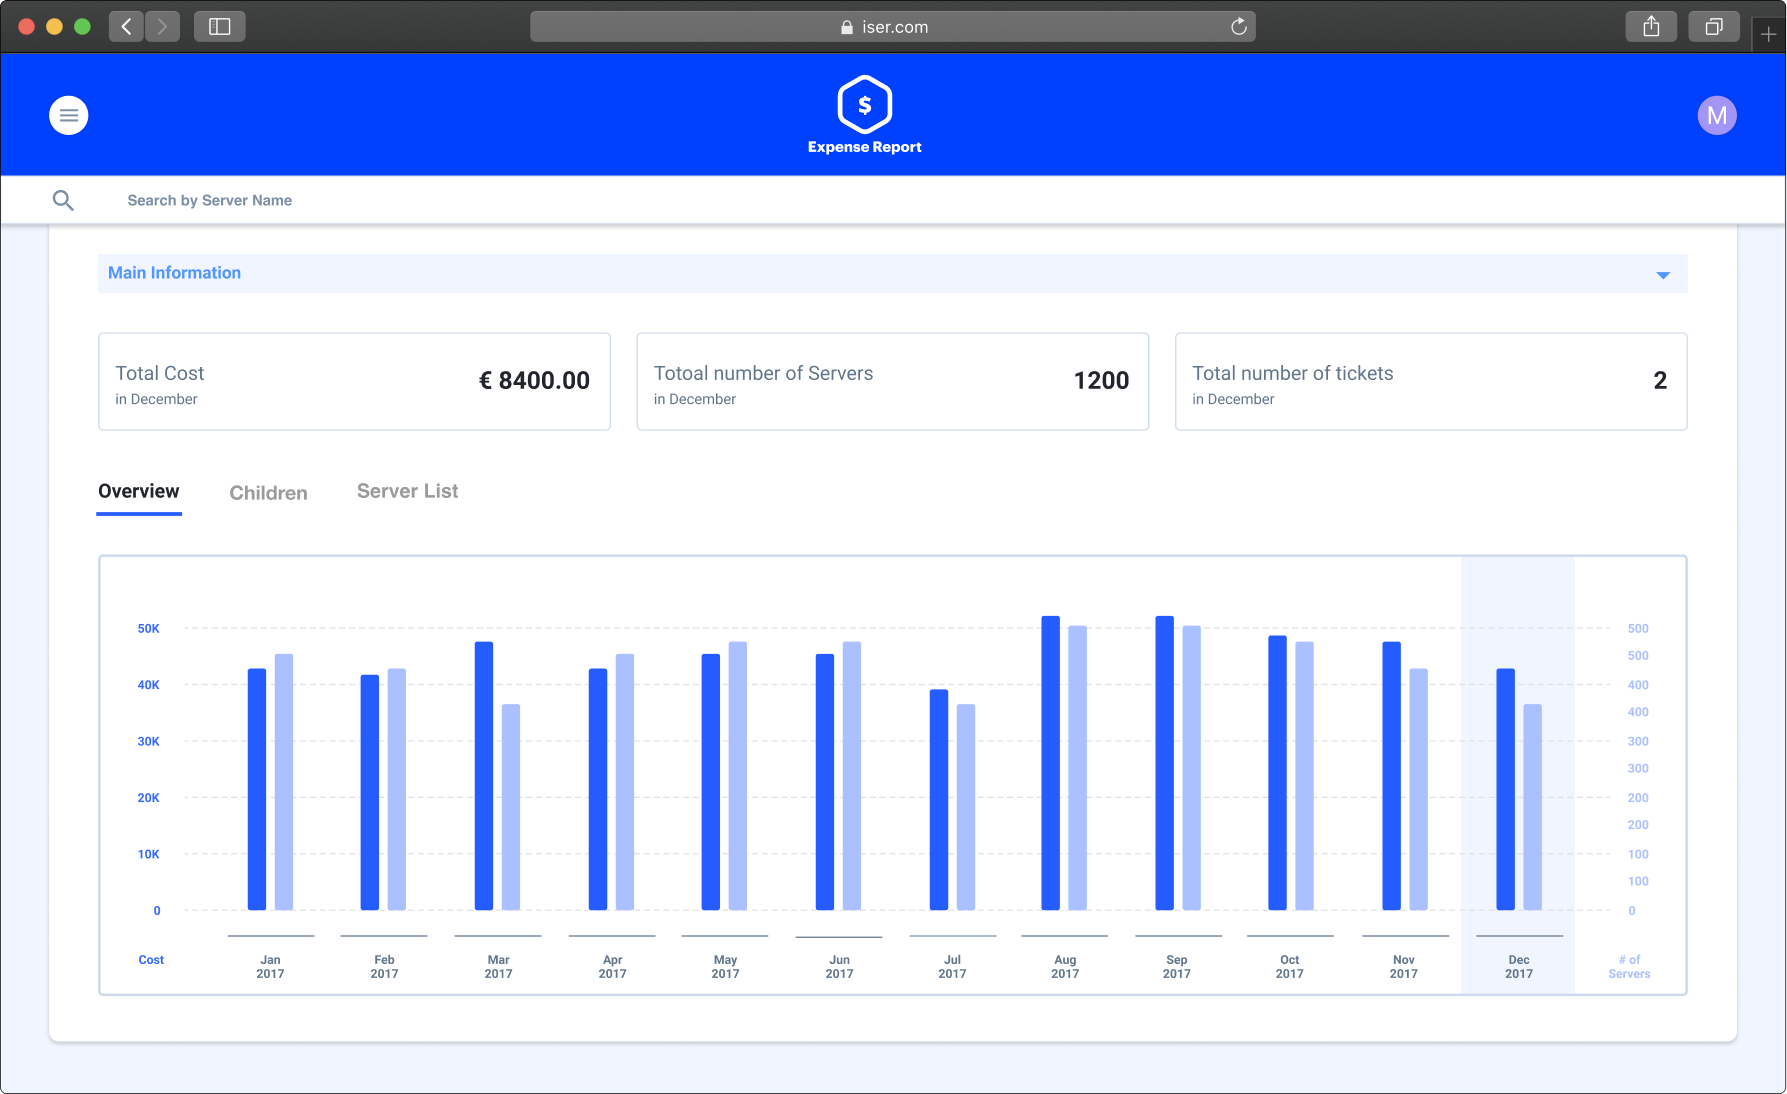
Monthly bar chart of aggregated cost and number of servers under the organization.
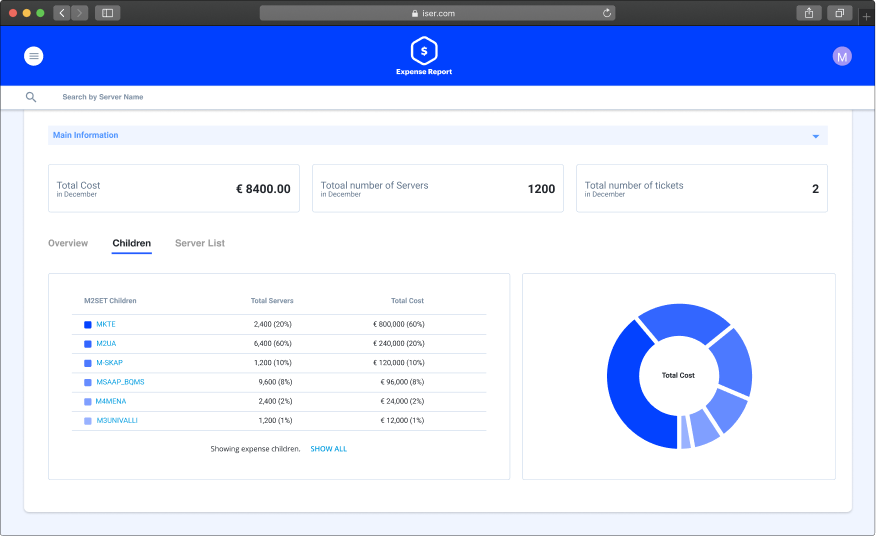
Showing children organizations spending in a list and pie chart.
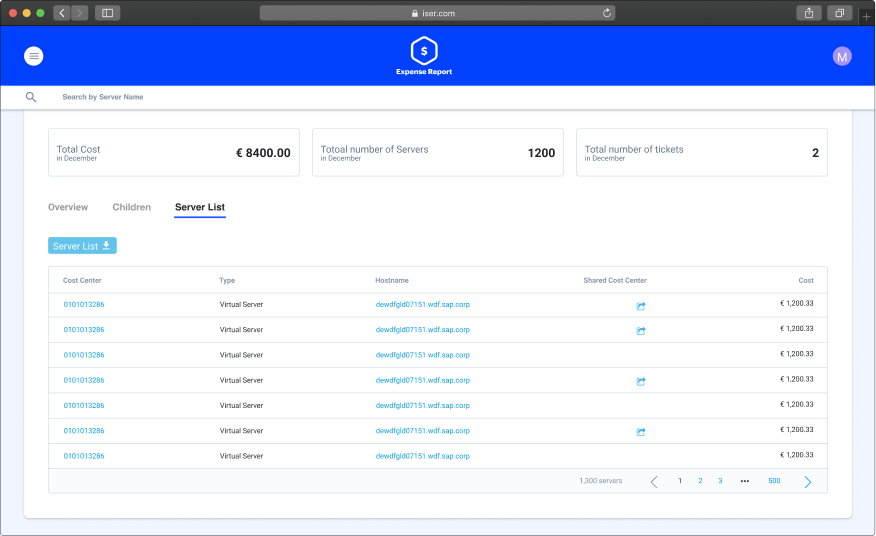
Showing all servers that under the specific organization.
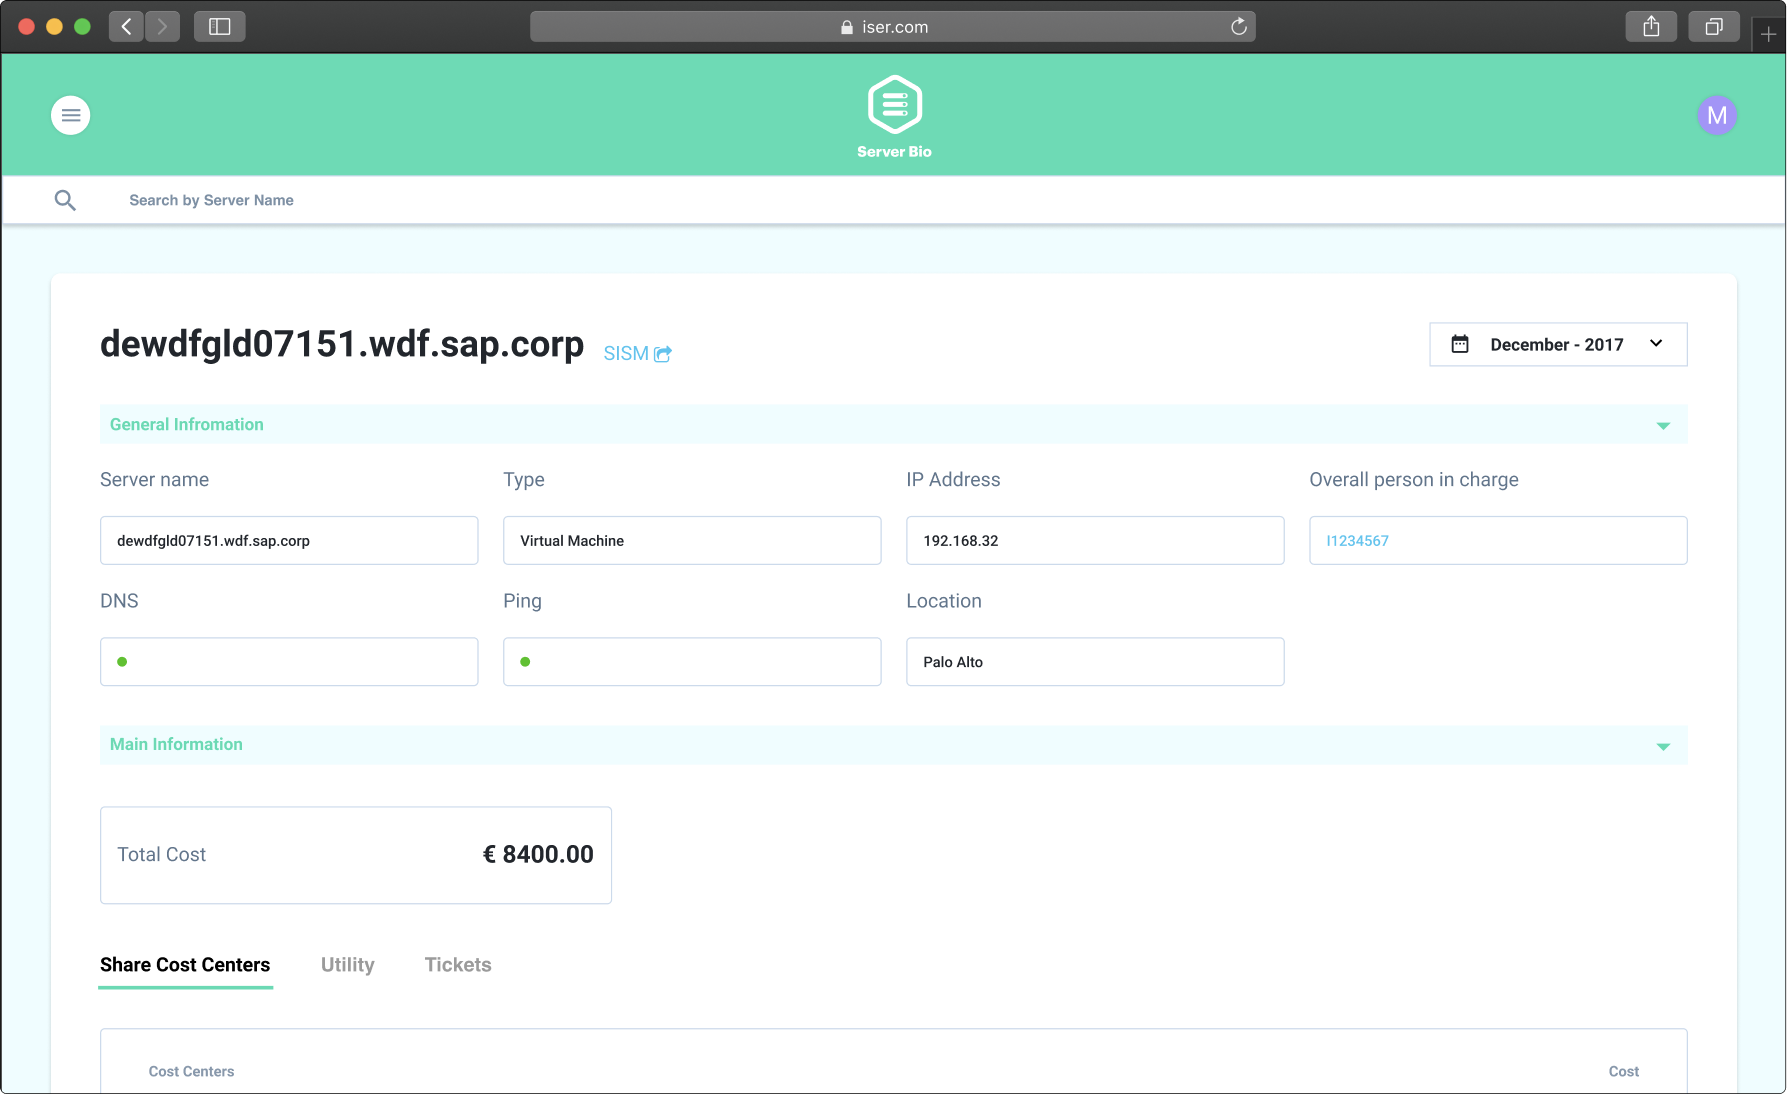
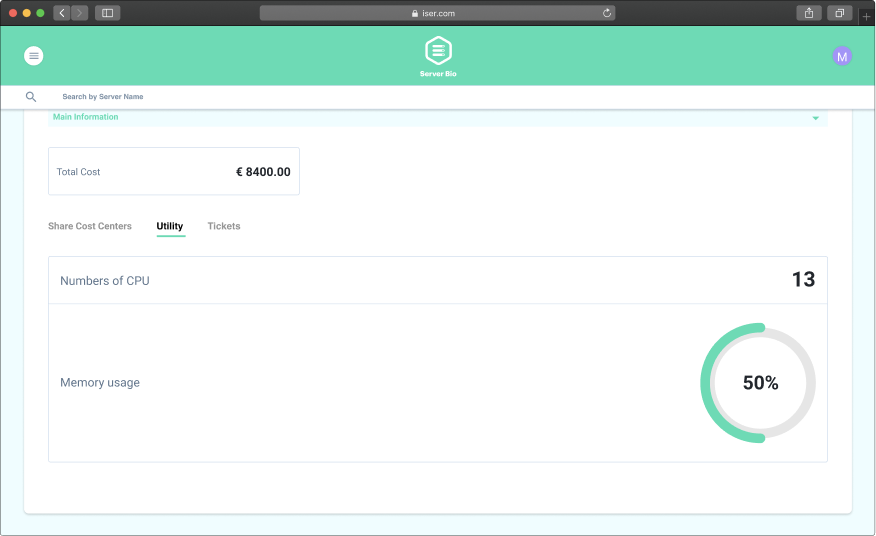
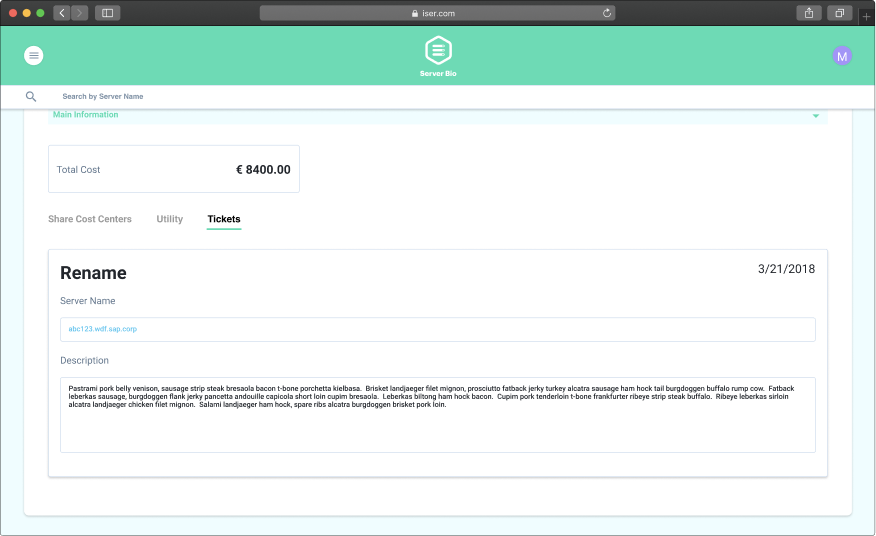
Server Bio
The Server Bio shows the server basic information such as the server owner(OPC), types, ping, etc. It also reveals the usage of each internal server, which helps the users to take action and make decisions for those servers. For example, generate a ticket for update the server info, or even terminate the server.
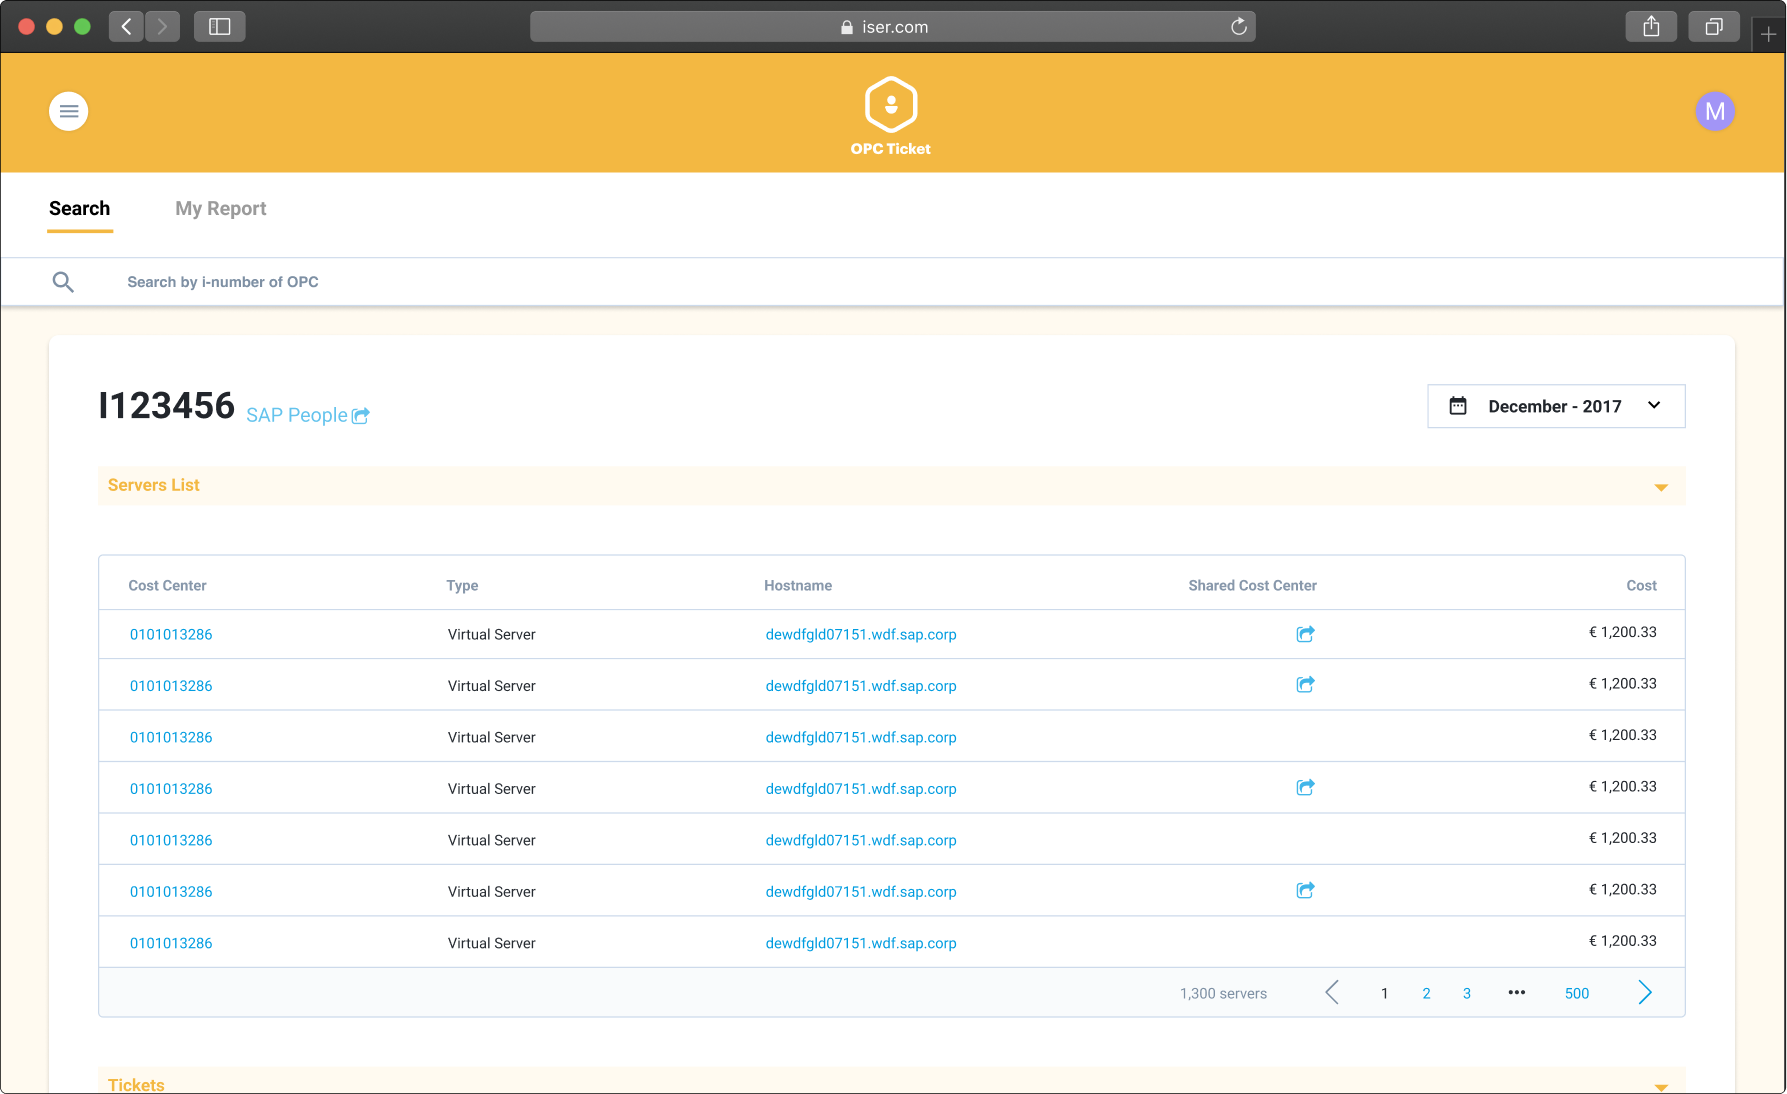
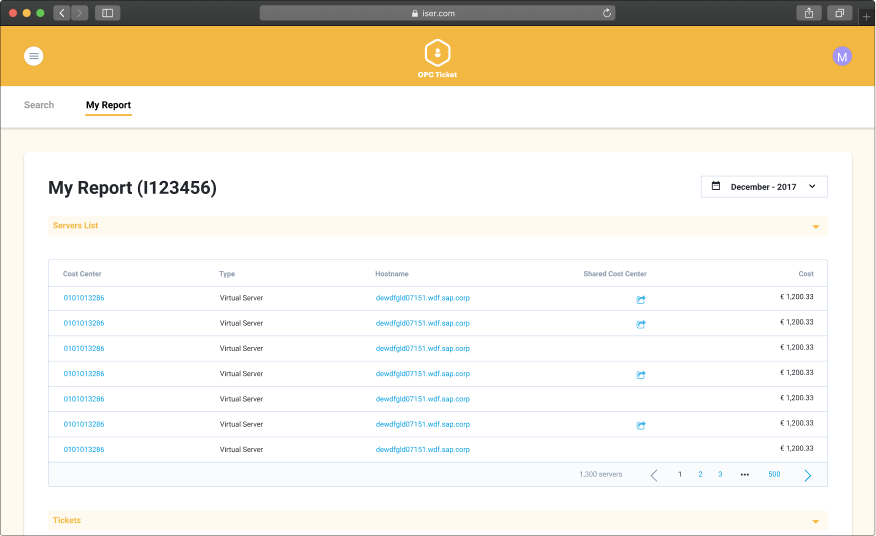
Showing all servers that own by an OPC.
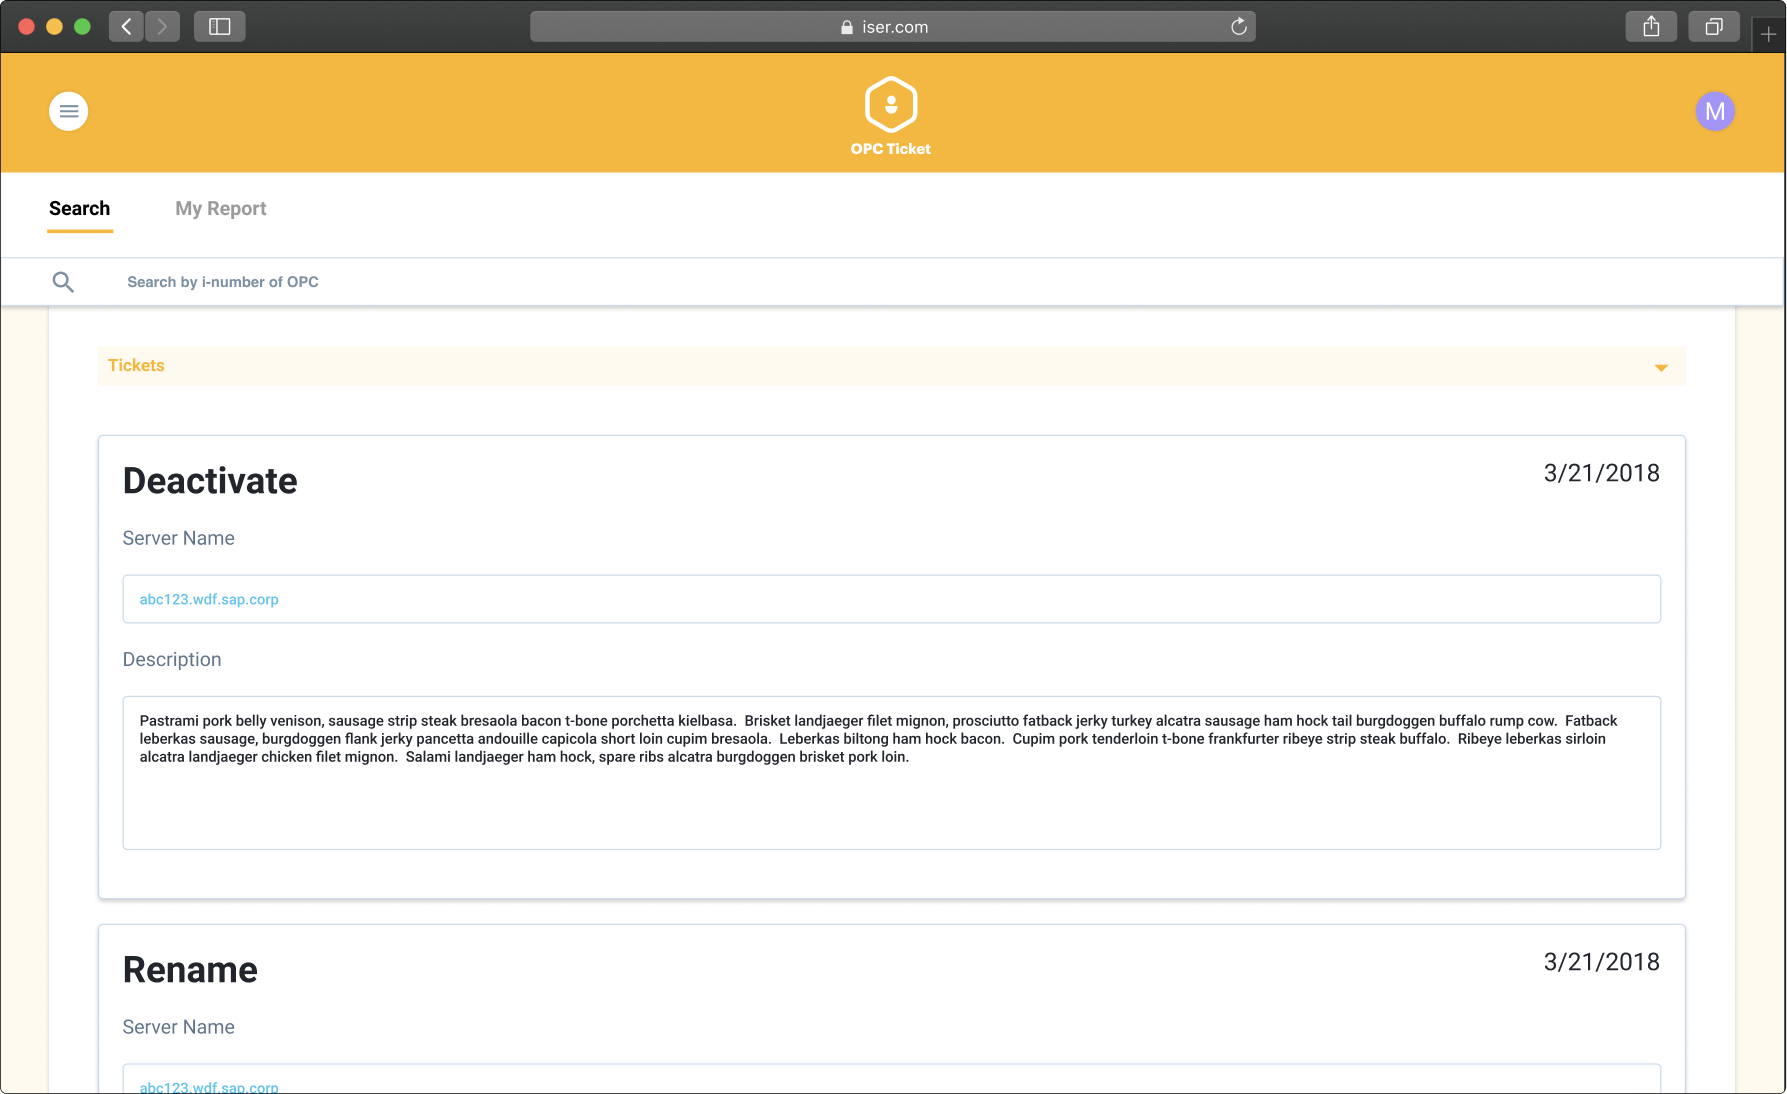
Showing tickets belong to the OPC.
Showing servers that owns by me as a OPC.
Resolve the ticket through the tickets.
OPC(Overall Person in Charged) Ticket
We generated tickets as actionable items for the overall person in charge. They'll receive an email with a CTA directing them to the OPC ticket app. Then, they'll resolve the ticket by starting the procedure according to the ticket.
Basic background info for individual server.
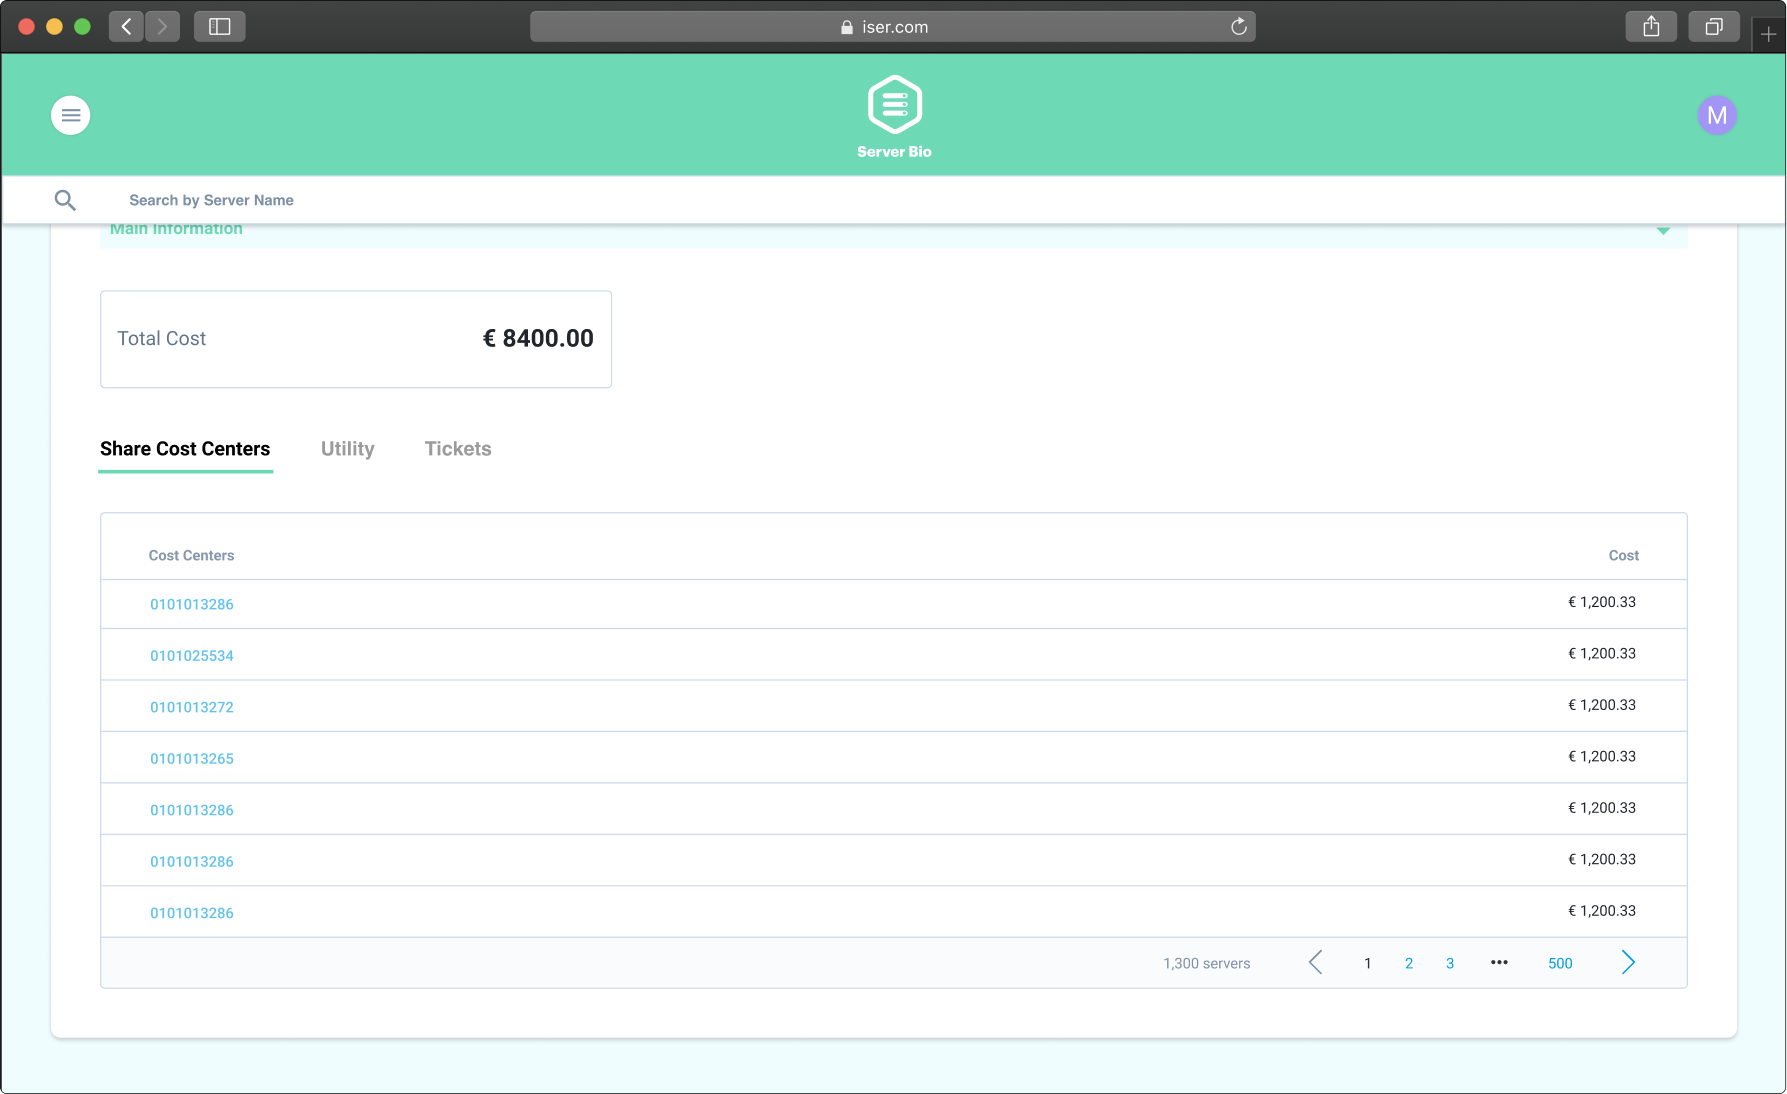
Showing all cost centers break down.
Utility information.
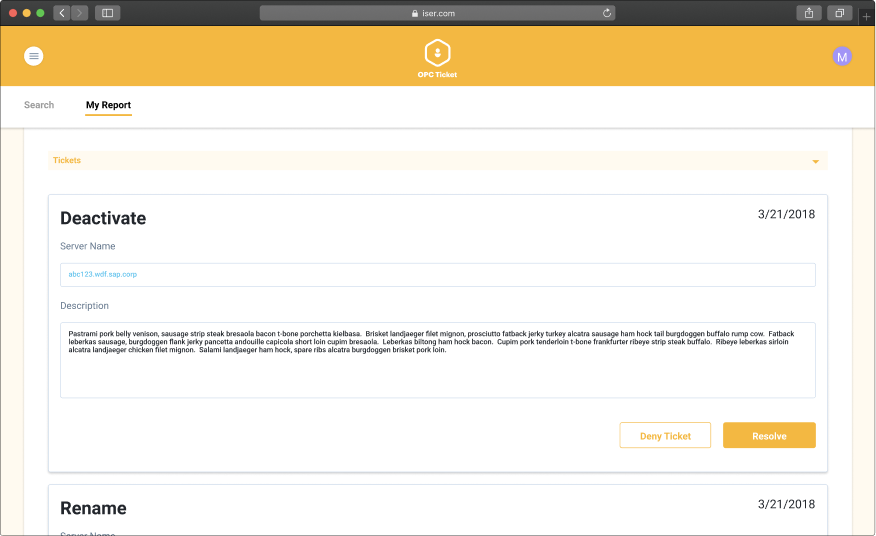
Showing the ticket which belongs to this server.
Main page
The landing page allows users to do a global search across these three applications by entering the UUID, I-numbers, or server name. Users can also go to the most relevant application directly and do the search in that application.
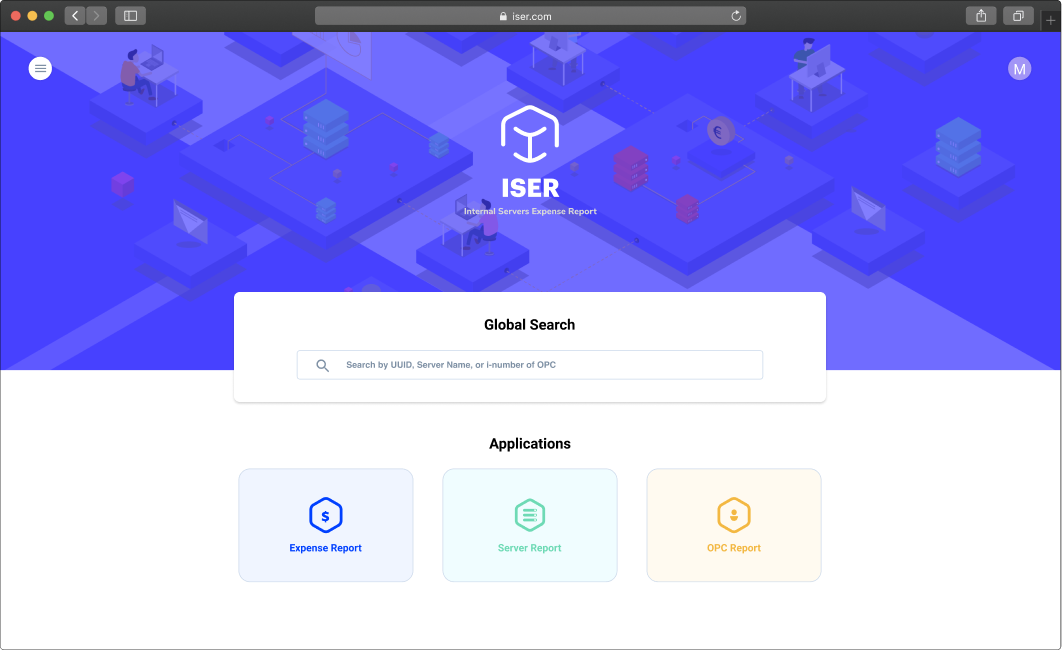
ISER’s landing page where allow users do a global search cross three apps or an option
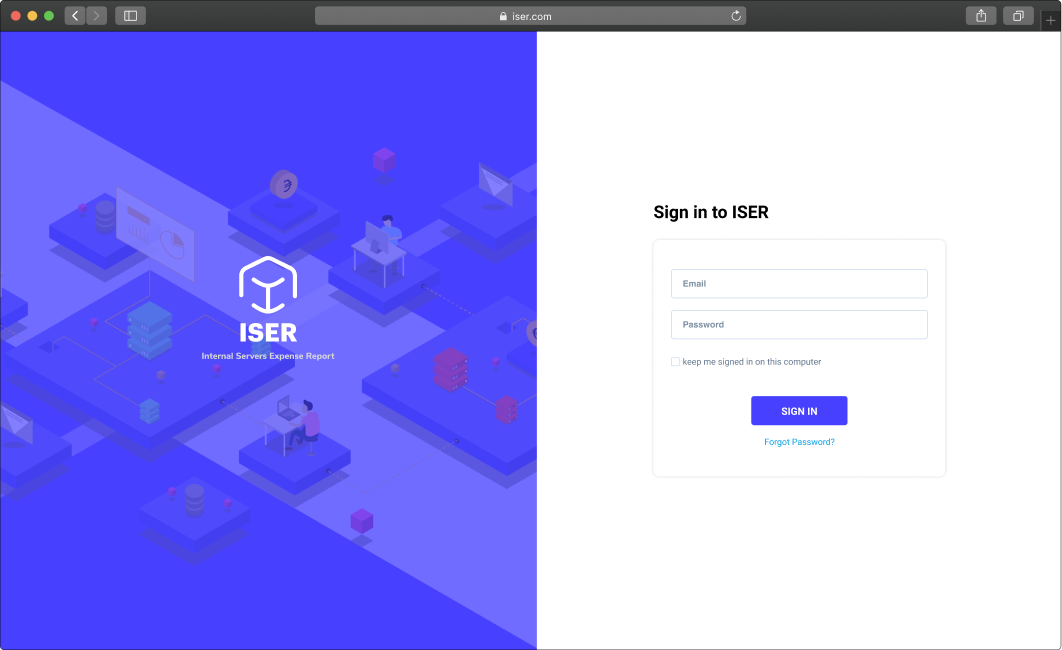
Sign in page
Final thoughts
We are still at the early stage of this project. We have our expense report application ready for assisting our users to monitor the monthly expense However, there are still many challenges that we are trying to figure out. Such as OPC has already left the company and we have no clue what is running on the instances owned by him/her; therefore, we cannot just terminate those servers.